As part of my projects in Geospatial Data Science and Remote Sensing, I developed a territorial analysis using open data from the Pays de la Loire region of France, integrating geographic processing techniques with Python, GeoPandas, and Shapely.
The aim of the project was to implement a complete spatial analysis workflow to assess the geographical distribution of tourist restaurants and explore territorial patterns based on official open public data sources.
🧩 Data and methodology
The analysis combined two main sources from the official open public data websites of Nantes Métropole and the Pays de la Loire.
- Tourist database of restaurants in the Pays de la Loire region (≈3375 records)
- Administrative boundaries of the region’s municipalities in GeoJSON format.
🧭 Workflow
- Data integration and standardization
Key fields were cleaned up, adjusting data types and spatial projections (CRS). - Exploratory analysis and visualization
Visual representations were generated, including maps, geolocated points, and buffers proportional to the number of restaurants per municipality. - Spatial synthesis
Municipalities with the highest concentration of tourists were identified, establishing a visual ranking of the Top 10 and Top 20 according to density.
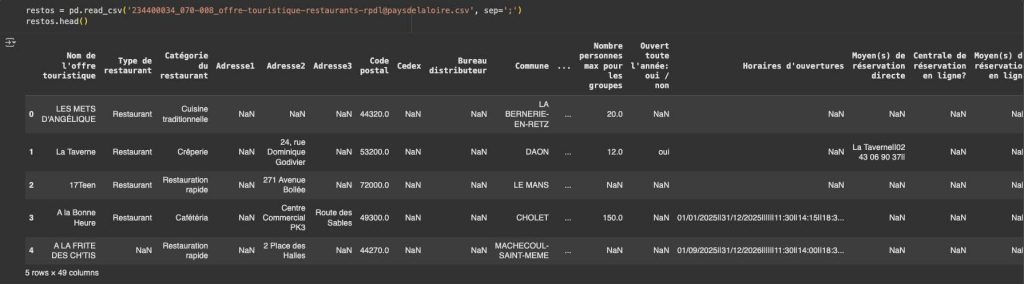
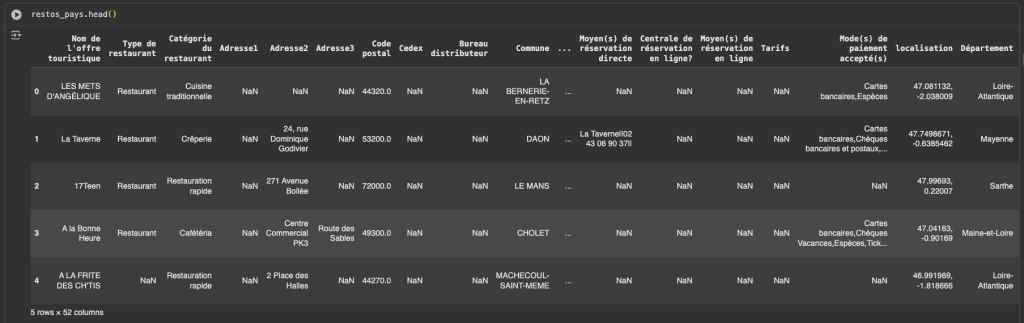
The dataset containing restaurant data (3,375 records) in 49 columns is a very interesting source of information that attempts to map multiple variables that impact the restaurant business. Unfortunately, we have a lot of missing data, which sometimes complicates the generation of insights.
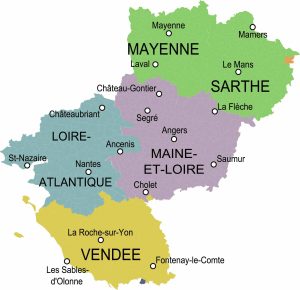
After performing a single count of the municipalities (communes) in the dataset containing the geometry of the Pays de la Loire, we see that there are 1,232 municipalities (communes) divided into five departments.
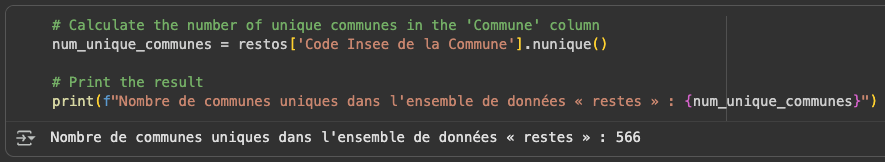
When consulting the unique number of municipalities in the dataset on restaurant tourism offerings, we realize that we have records for 566 municipalities, less than half.
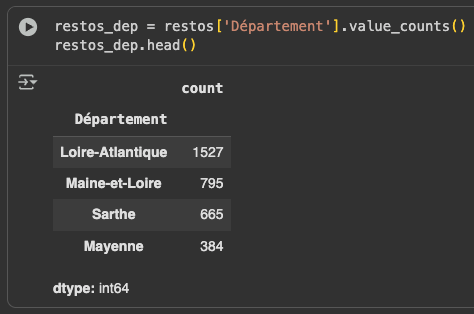
Counting the values in the “Département” column, we verify that there are no records for the Vendée department. For this reason, we will see later that there are no geolocated restaurants at the bottom of the Pays de la Loire map.
Both sets were integrated using the INSEE code to build a coherent geospatial infrastructure, enabling density and distribution analyses to be performed.
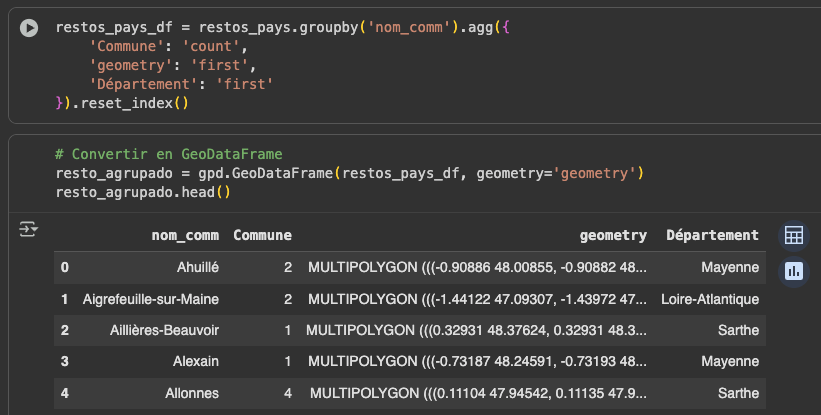
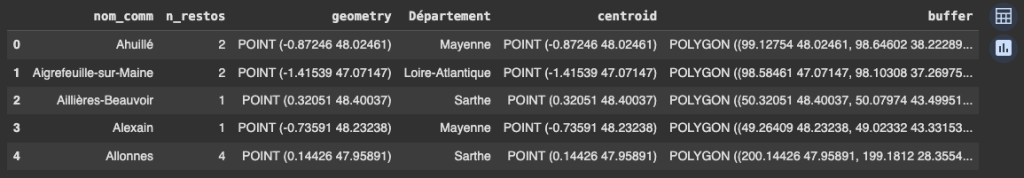
From this dataframe, we create a Groupby grouping to filter some columns that we will need: nom_comm, Commune, Geometry, and Département. Then we convert it into a Geodataframe.
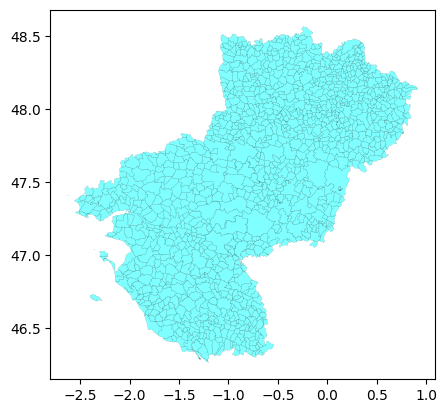
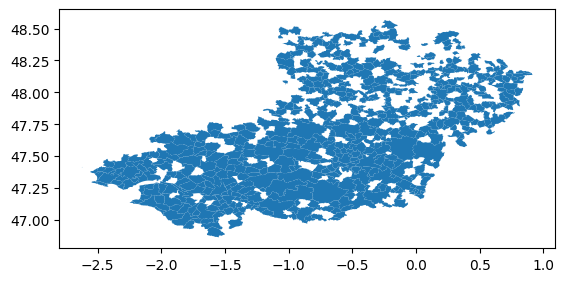
After creating our first plot of this Geodataframe, we found that:
- There are many municipalities that do not have data—restaurant records.
- The map looks disproportionate because it does not have the same CRS (Coordinate Reference System).
- The lower part of the map corresponding to the Vendée is not visible, as there are no records.
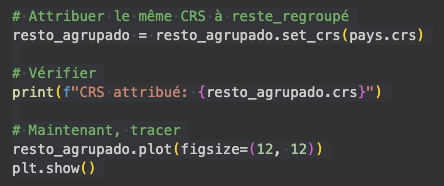
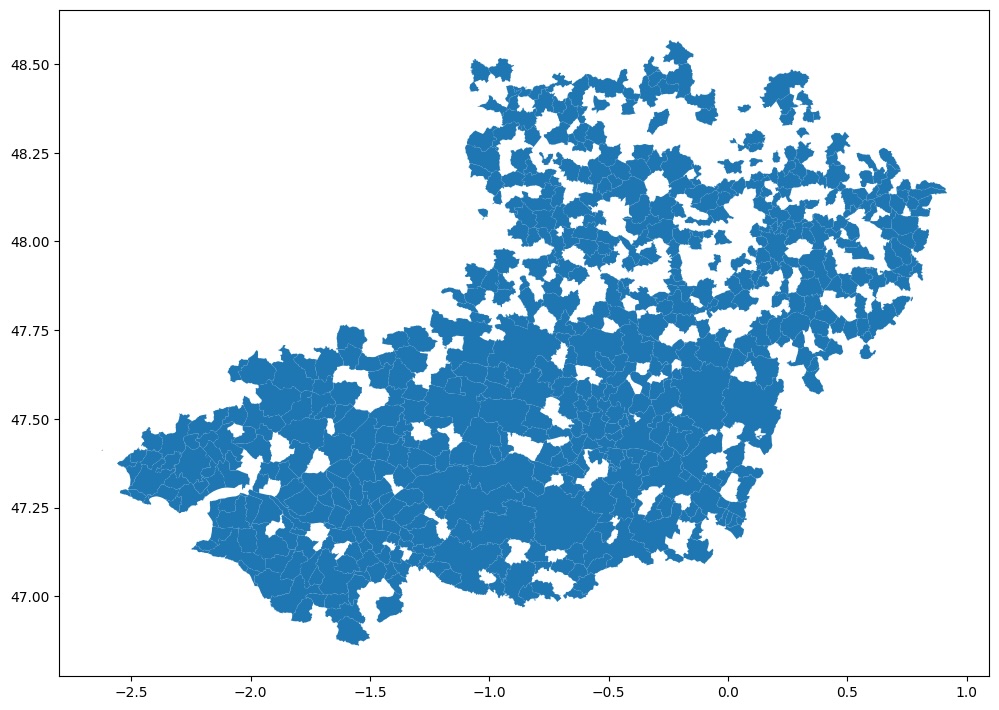
We will assign the same CRS as the main Pays de la Loire geodataframe and then recreate the plot.
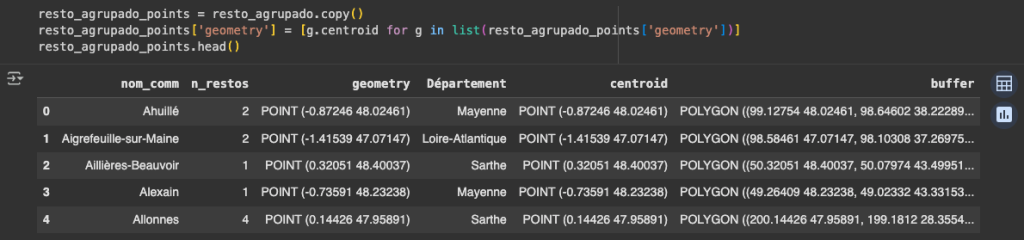
We create a column containing the “Centroid” of each municipality and another that calculates the Buffer for each Centroid point.
Now we can generate our first choropleth map showing the density of restaurants per municipality.
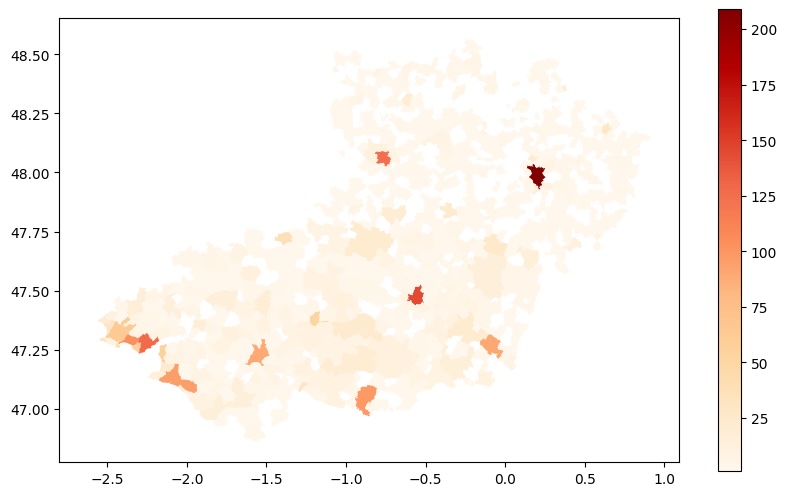
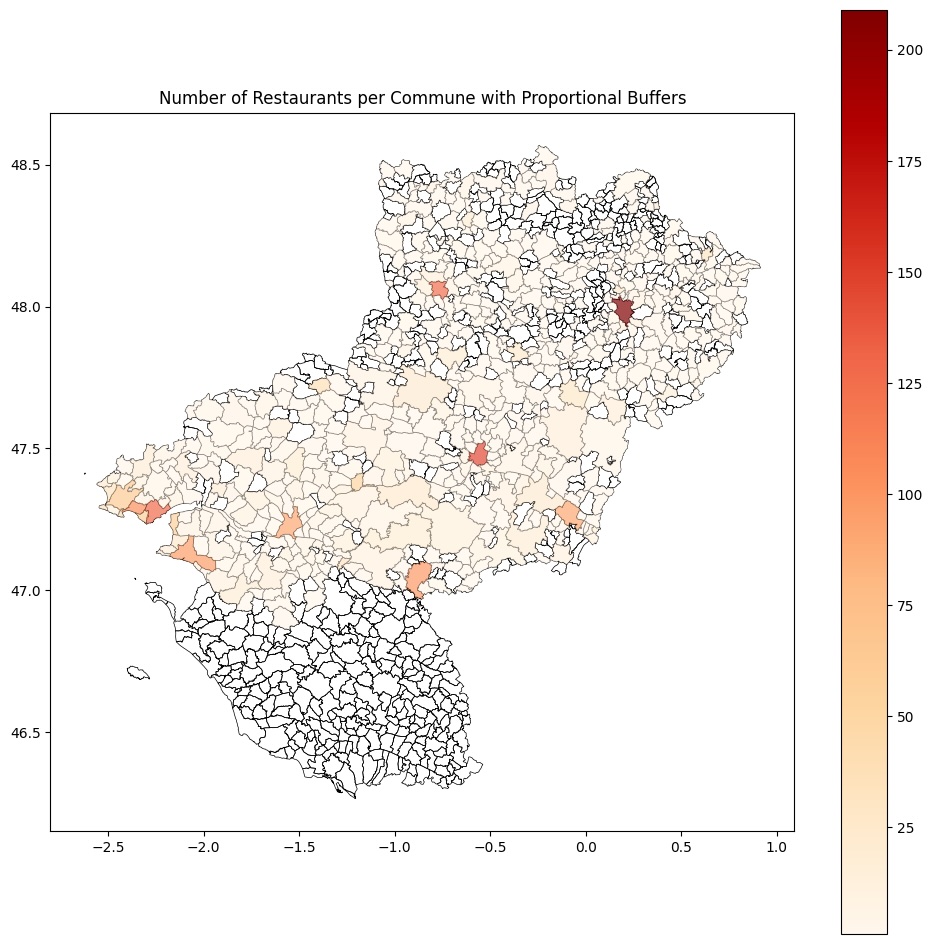
And now another map showing the number of restaurants, which displays municipalities without values or data, including the Vendée department at the bottom.
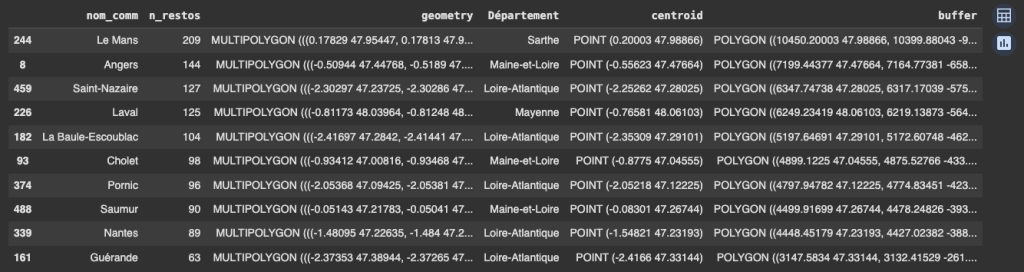
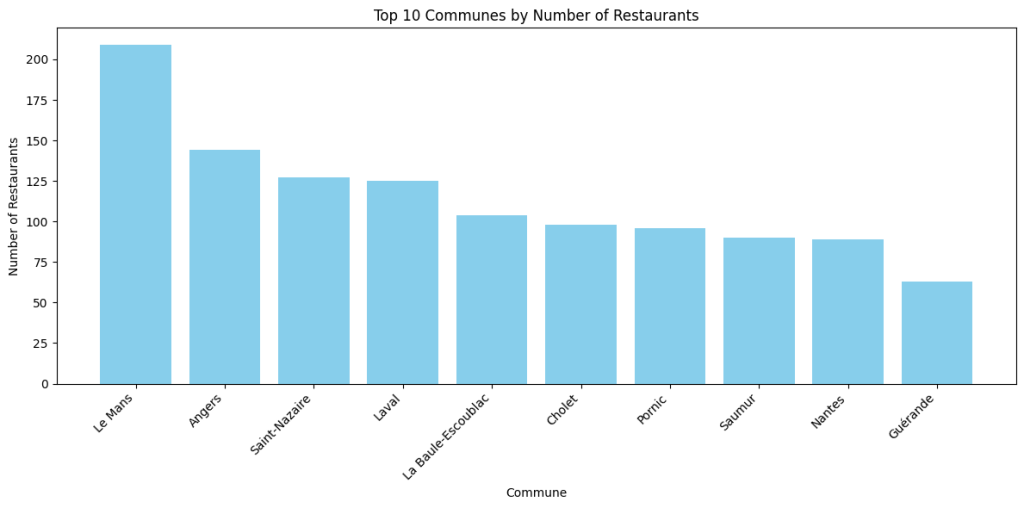
We have already identified the municipality with the highest density on the map. Now we can see the top 10 municipalities with the most restaurants according to the dataset.
We make a copy of the dataframe where we assign the centroid point as the main “Geometry,” and then we plot it.
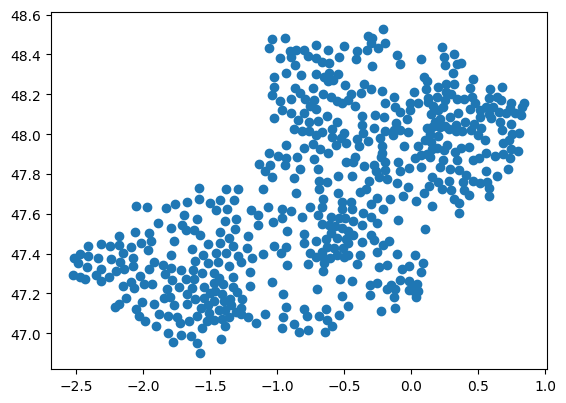
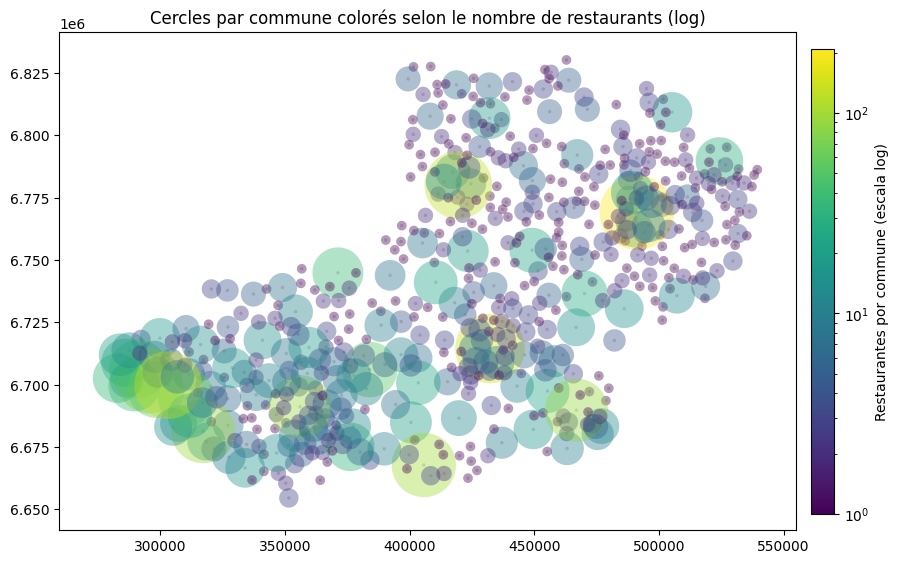
Now we can create a first visualization with the centroids and their buffers growing logarithmically based on the number of restaurants per municipality.
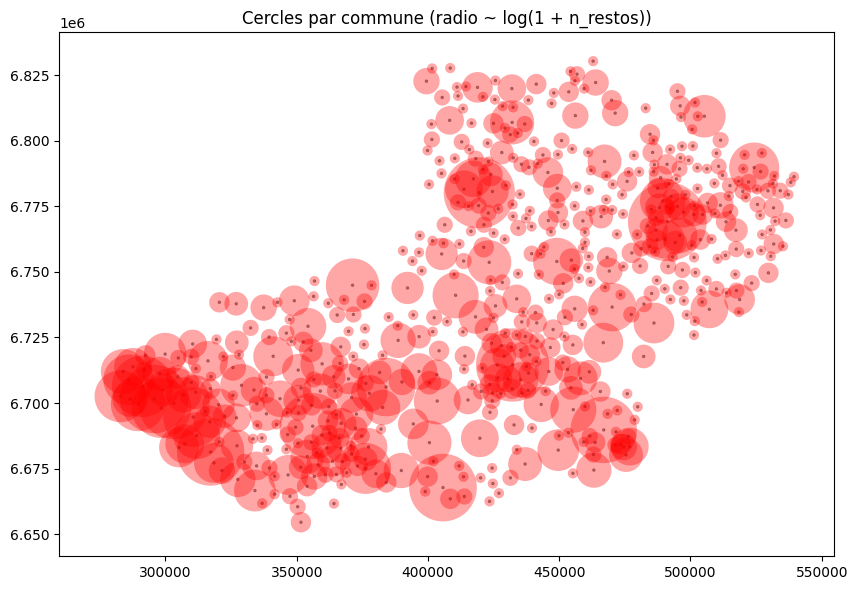
We cannot clearly see the differences, so we create another version with the “Viridis” color map. We keep all the centroid points, even those without restaurant records.

The next step will be to visualize the top 20 and top 10 municipalities that are growing in their buffer in relation to the number of restaurants. We show the labels and values for each point.
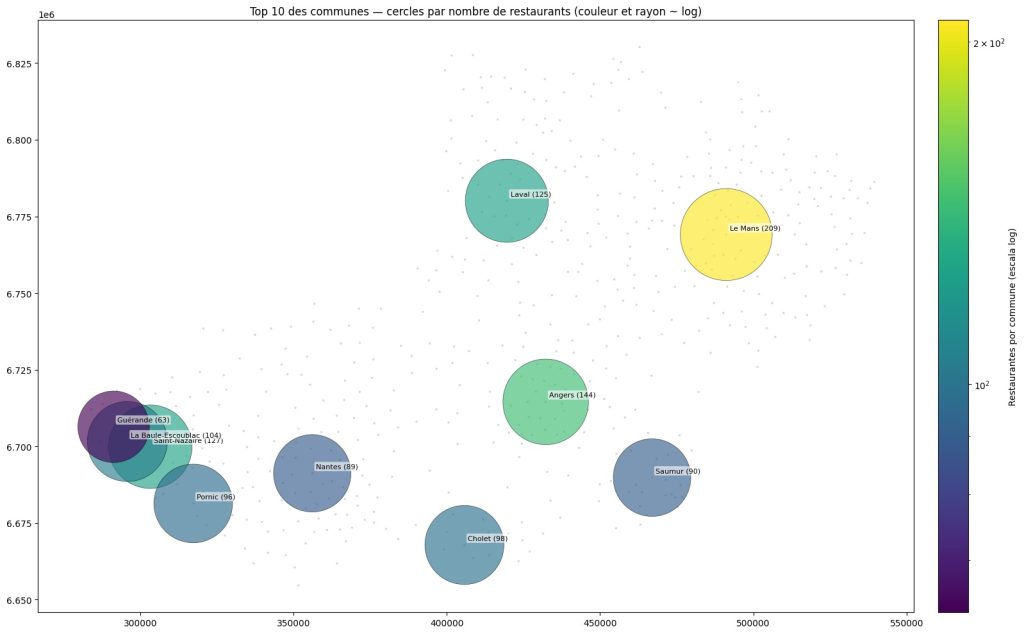
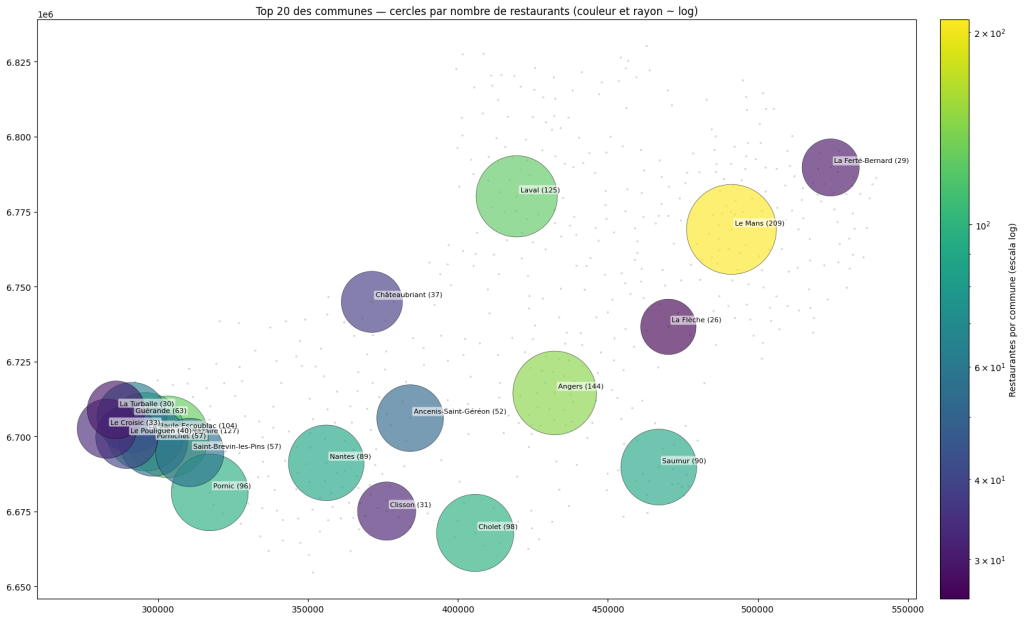
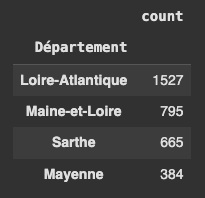
Here we show on the left that there is a group of municipalities in Loire Atlantique (1527) which together make up the majority of the tourist offering of restaurants in the Pays de la Loire region, which we verified by counting our dataset.
📊 Key findings
The initial analysis positioned Le Mans as the municipality with the highest number of tourist restaurants, and Loire Atlantique as the department with the highest density of tourist restaurants, according to the dataset. However, a contextual review with other current sources revealed that Nantes has a wider offering, given that the dataset does not cover the entire commercial universe.
According to several tourism and gastronomy websites, information was collected from the local Chamber of Commerce and Industry in Nantes, indicating 1,414 restaurants in its registry. In 2017, 3,737 catering establishments were reported (including restaurants of all types).
The dataset we used in this spatial analysis is provided by the e-SPRIT network: an electronic system of professionals in the tourist information network. It provides us with a list of tourist restaurants in the Pays de la Loire region, and does not necessarily represent an exhaustive count of all restaurants in each city.
Now, Le Mans‘ position in first place raised more questions for me about which events or activities attract the most visitors or tourists in France, and as a result, could increase the number of restaurants and hotels on offer.
Here is a quick comparison, according to data from Wikipedia:
| Event | Approximate attendance | Frequency | Type |
|---|---|---|---|
| Tour de Francia | 10–12 million (spread across the country) | Annual | Sport (cycling) |
| Braderie de Lille | 2.5–3 million (weekend) | Annual | Cultural/commercial |
| Salon de l’Agriculture (Paris) | 600–700 thousand (one week) | Annual | Fair |
| Hellfest (Clisson) | 400 thousand (weekend) | Annual | Music |
| 24 Horas de Le Mans | 330 thousand (weekend) | Annual | Motorsports |
| Champions League Final (Paris) | 75 thousand | Occasional | Sports (soccer) |
In terms of audience concentration in one place and over a short period of time, Le Mans ranks among the top 4–5 in France.
Events such as the Braderie de Lille and the Tour de France surpass it in total numbers, but Le Mans is unique for its international character and prestige within motorsports. With more than 300,000 attendees in a single weekend, Le Mans is among the sporting events with the largest audiences in France. These numbers show that it is not just “another car race”: it is an iconic motorsport event with historical, cultural, and media significance. Attendance has been growing, suggesting that its popularity continues to rise.
This finding underscores the importance of interpreting spatial data in its socioeconomic context, avoiding conclusions based solely on geographic frequency.
🧠 Conclusions and projections
The project demonstrates the potential of geospatial analysis applied with Python for territorial characterization and data-driven decision-making.
The tools implemented allow the workflow to be replicated in other domains, such as urban planning, environmental management, and sustainable tourism.
“The territory is better understood when the data tells its story.”
I see spatial data as a useful and fascinating world for finding impactful solutions that innovate and add value to what interests us. I am currently taking Milan Janosov’s Geospatial Data Analytics courses, where we get closer to the domain and taste for spatial data through the implementation of real cases. I hope to be able to deepen and advance my knowledge.
#DataScience #GeoPandas #GIS #RemoteSensing #GeospatialAnalysis #Python #DataVisualization #TourismData #PaysDeLaLoire #Nantes #DataDriven


