▎ 🎮 Piloting Percy · 📊 Dashboard · 📚 Documentation dbt · 💻 Code source
Project Origin
A few years ago, I visited the Cité de l’espace in Toulouse. There, I learned that SuperCam, one of the main instruments on the Perseverance rover, was developed through a Franco-American collaboration: CNES and IRAP in Toulouse, alongside the Los Alamos National Laboratory, for NASA.
Watching the replica of the rover in motion, I imagined an interactive installation where the public could pilot Perseverance, track its telemetry, and discover the actual images it captures on Mars.
The Challenge
I wanted to build two things:
- A public experience that is simple to understand within seconds, available in French, and designed for a museum or planetarium.
- A genuine, automated, tested, and reproducible data platform behind it. This is where my career transition into data engineering comes into play.
The Experience: Piloting Percy
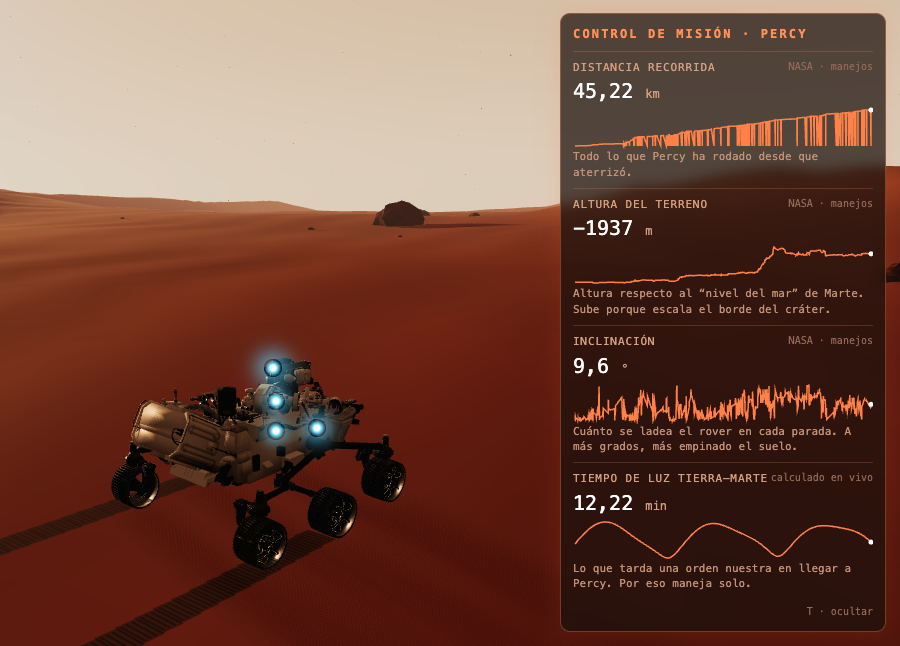
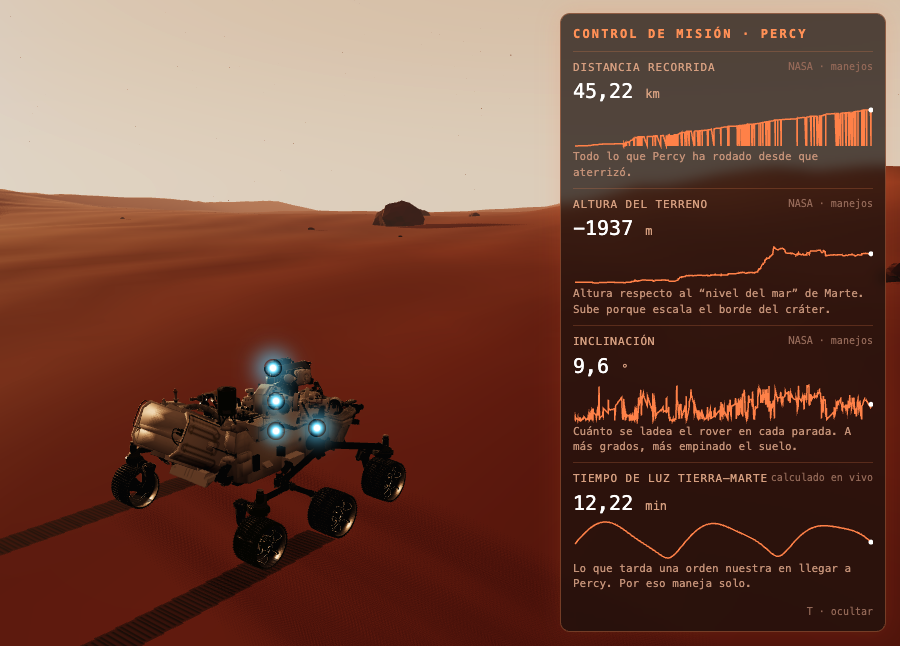
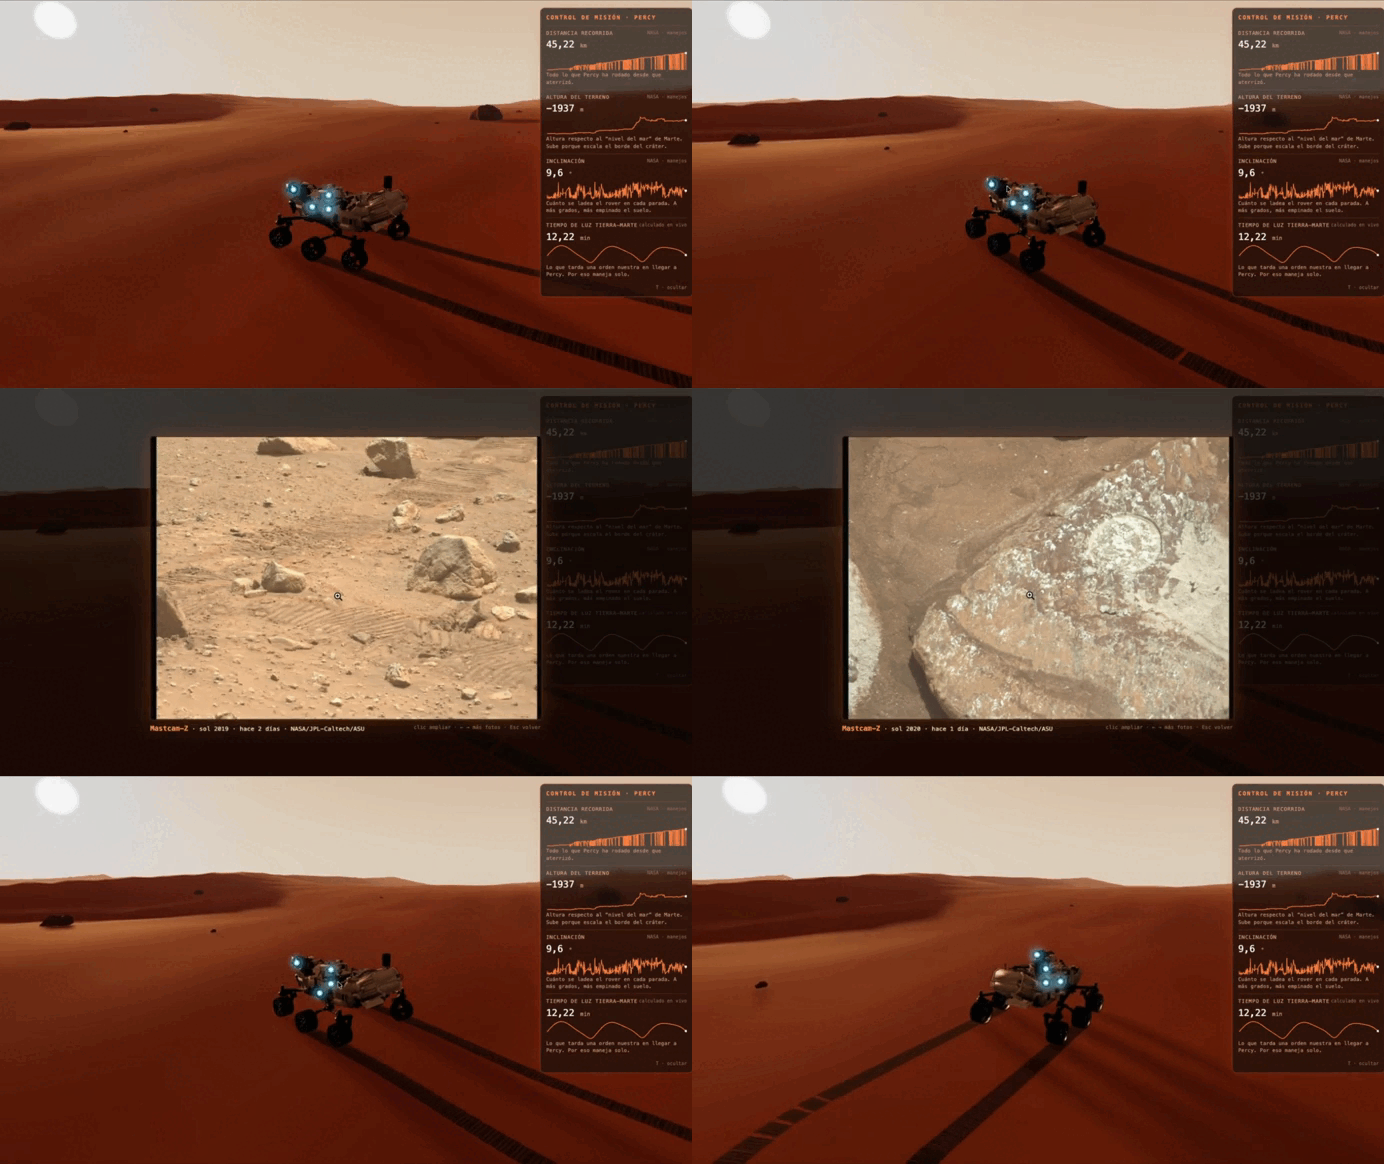
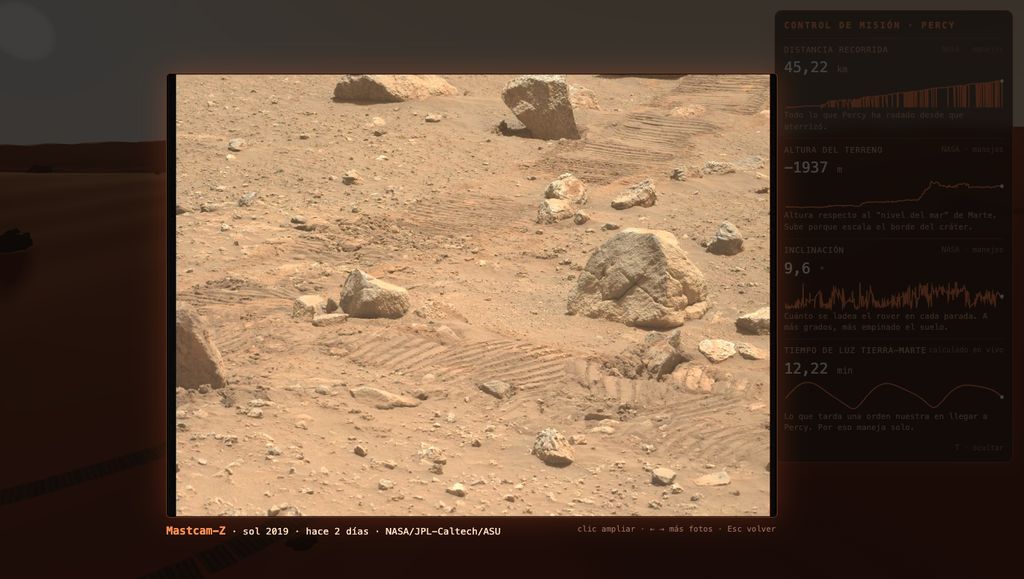
- A 3D rover with Martian physics: 3.71 m/s² gravity, rocker-bogie suspension, and six rotating, steering wheels. It is controlled using a keyboard (QWERTY and AZERTY).
- Mission control with real data: Distance traveled, terrain elevation, and tilt are sourced from trajectories published by NASA. The Earth–Mars light-travel time is calculated live using orbital elements from JPL.
- The rover’s cameras: Mastcam-Z, Navcam, Hazcam, and WATSON: a single click triggers the shutter and flash, revealing an actual color photograph taken on Mars along with the sol and day count.
- Bilingual: The interface defaults to French, with an option for Spanish.
The Data Platform
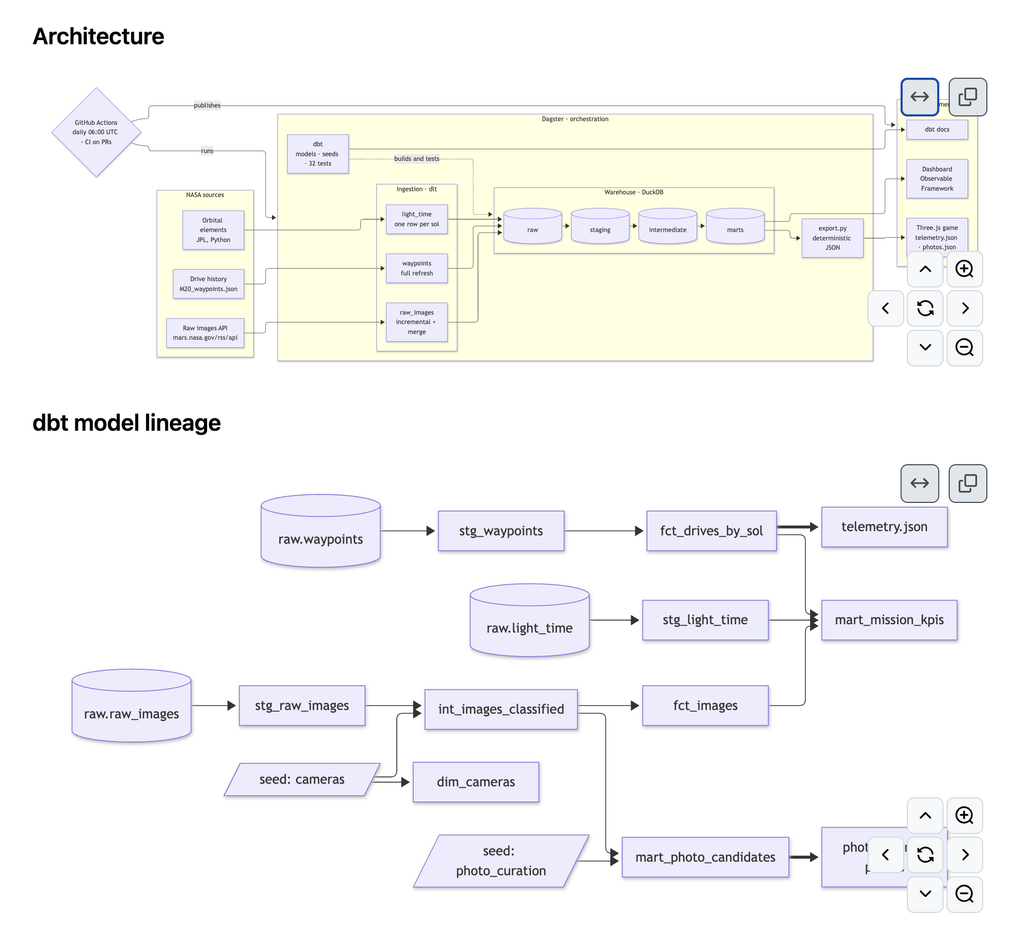
The game is merely the final link in a compact, completely free Modern Data Stack:
| Layer | Tool | Role |
| Ingestion | dlt | Incrementally loads raw trajectories and images from NASA (cursor on reception date, merge on identifier). |
| Data Warehouse | DuckDB | A single file organized into raw, staging, intermediate, and marts layers. |
| Transformation | dbt | Models data and runs 32 quality tests alongside source freshness checks. |
| Orchestration | Dagster | A single asset graph spanning from NASA data to game files, featuring blocking checks and daily execution. |
| Visualization | Observable Framework | A static dashboard detailing mission metrics. |
| CI/CD | GitHub Actions + Pages | Runs tests on every pull request. Daily data refreshes trigger automated publishing of the game, dashboard, and documentation. |
Human in the loop: dbt rules pre-select photos (color, resolution, unfiltered for calibration). The final selection remains human-curated within a versioned CSV file.
What the Tests Revealed
The automated test suite uncovered real issues that were invisible to the naked eye:
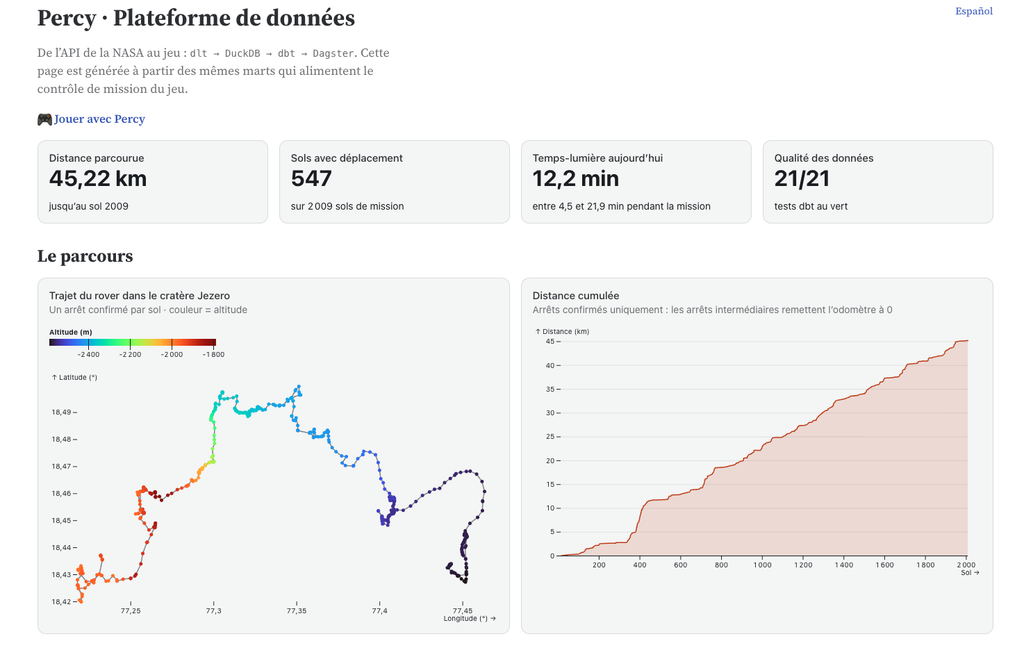
- Odometer resetting to zero: Intermediate stops published by NASA lack odometer values, causing distance graphs to drop unexpectedly. Marts now filter for confirmed stops only.
- Timestamp offsets: Photo timestamps previously depended on the host machine’s local time zone. They are now explicitly converted to UTC.
- Non-deterministic ordering: Photos captured during the same second swapped positions between runs, triggering unnecessary bot commits. Adding a tie-breaker criterion (
image_id) resolved the issue.
Competencias aplicadas
Data Engineering: Incremental ingestion, layered modeling, quality testing, asset-based orchestration, data contracts, CI/CD, and deterministic outputs.
Development: Python, SQL, JavaScript, Three.js, Vite, and end-to-end browser testing in headless mode.
Methodology: Rapid prototyping using Claude Code followed by iterative industrialization, with every step validated by automated tests.
Key Skills Applied
Next step: Turn this prototype into a physical exhibit for a museum or planetarium and integrate images from SuperCam—the very instrument that inspired this journey.
Do you work at Cité de l’espace, a planetarium, or in science communication? Or are you hiring for a data engineering role? Feel free to reach out—I’d love to chat!