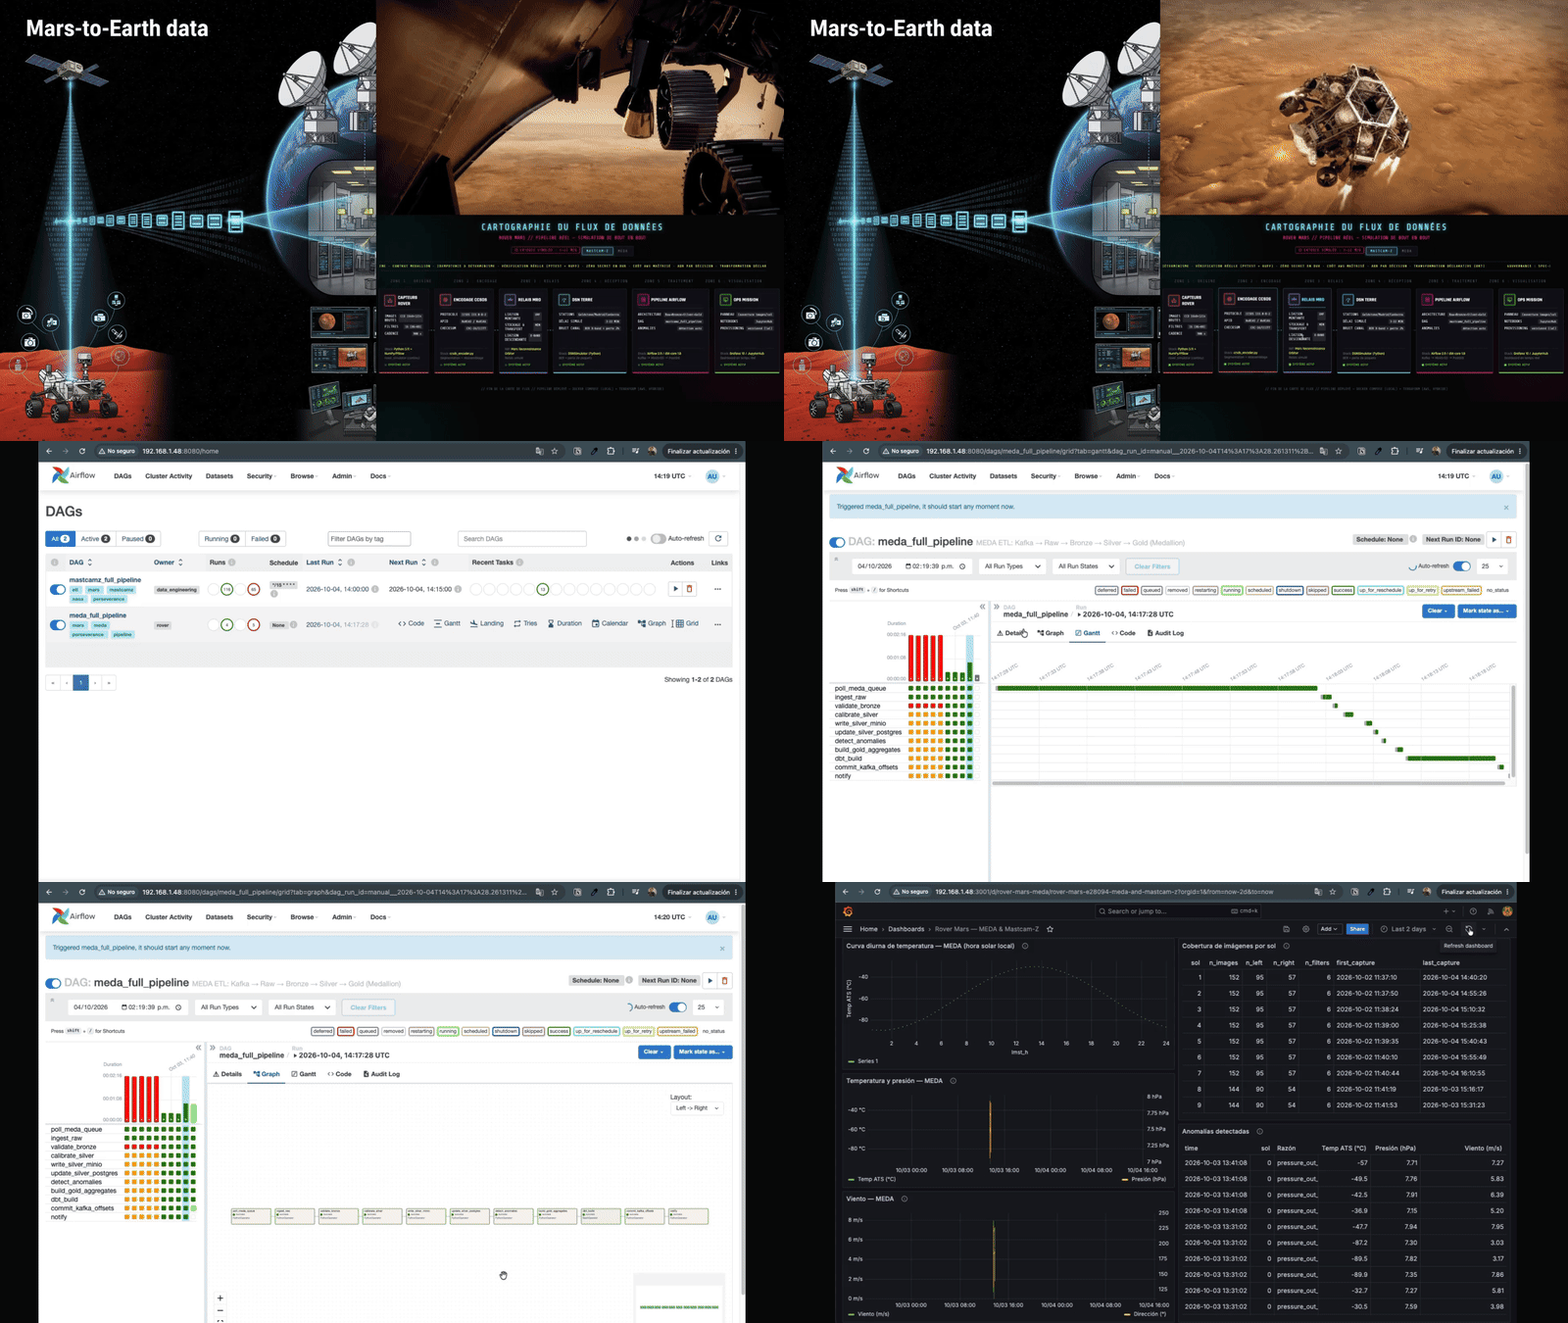
I rebuilt, end to end, the system NASA uses to receive and process photos and environmental data from the Perseverance rover on Mars. This isn’t a sample notebook: it’s a real data pipeline, using the authentic space protocol, running on continuously generated data.
Cartographie du Flux de Données
- IMAGES BRUTESCCD 1648×1214
- FILTRES16 (8G+8D)
- TEMPÉRATUREATS
- PRESSION / VENTPS / WS
- CADENCE900 s
rover_simulator (continu)
- PROTOCOLECCSDS 133.0-B-2
- APID0x01A5 / 0x01A6
- APID0x0C0–0x0C4
- CHECKSUMCRC-16/CCITT
Segmentation + réassemblage
- LIAISON MONTANTEUHF
- STOCKAGE & TRANSFERTMÉM
- LIAISON DESCENDANTEX-BAND
Relais simulé
- STATIONSGoldstone/Madrid/Canberra
- DÉLAI SIMULÉ3–22 MIN
- BRUIT CANALBER X-band + perte 2%
BER + perte de paquets
- ARCHITECTURERaw→Bronze→Silver→Gold
- DAGmastcamz_full_pipeline
- DAGmeda_full_pipeline (11 tâches)
- ANOMALIESdétection auto
Kafka → MinIO/S3 → PostGIS
- PANNEAUCouverture images/sol
- PANNEAUXTemp/Press/Vent/Anomalies
- NOTEBOOKSJupyterHub
- PROVISIONINGversionné (IaC)
Dashboard en temps réel
The problem
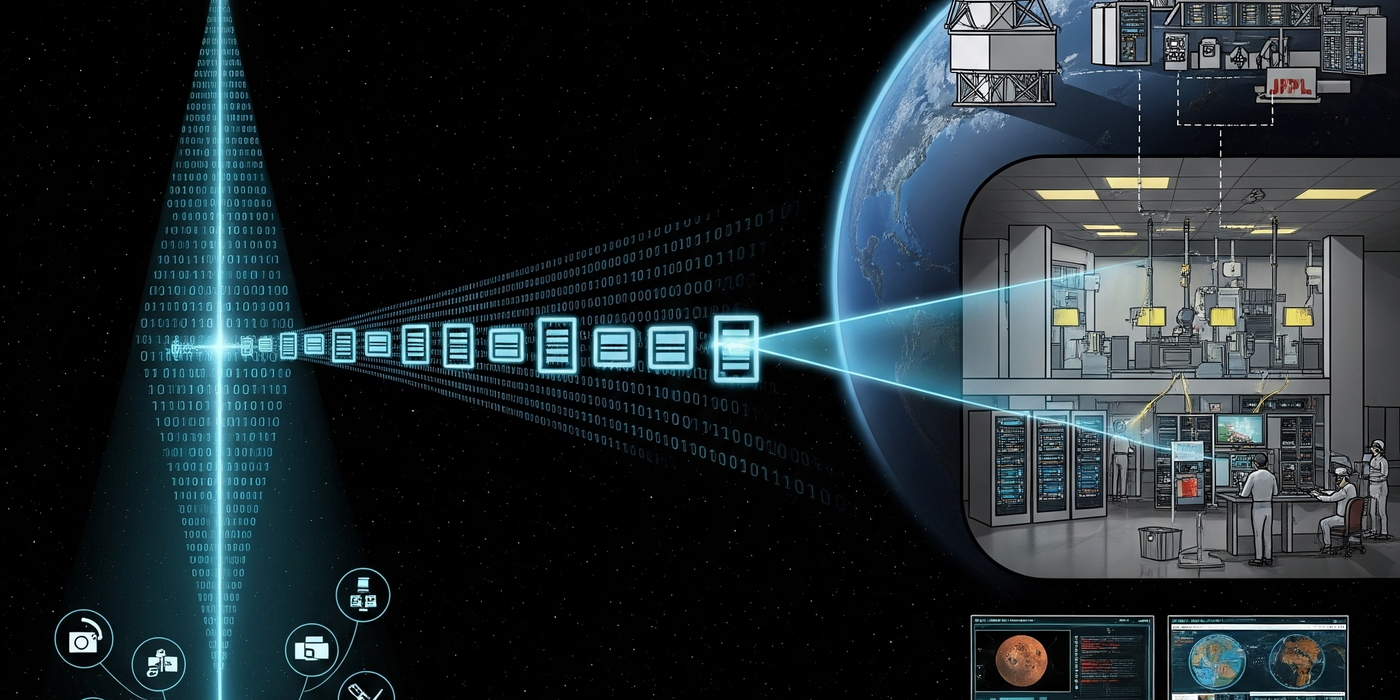
Every time the Perseverance rover takes a photo or measures temperature on Mars, that data travels inside a real space protocol (CCSDS), crosses between 3 and 22 minutes of space to reach Earth, and only then does an engineering team receive it, validate it, calibrate it, and turn it into something scientists can use. I wanted to build that full system: not a toy simulation, but the architecture a professional data team would use to solve this problem.
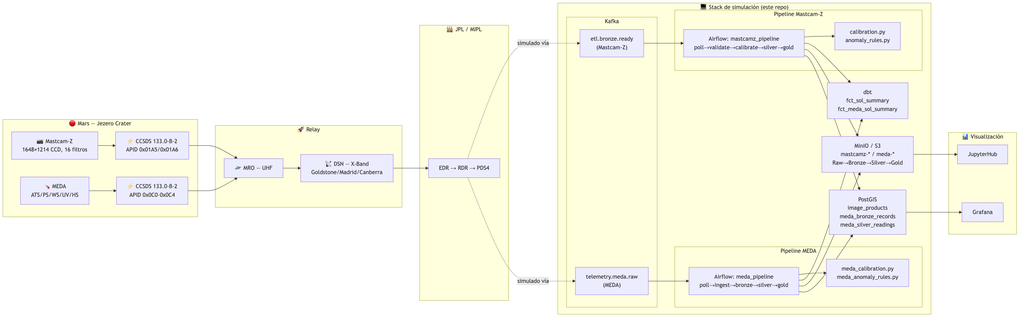
Information System – Architecture
What I built
- The real protocol, not an invented version: a simulator that packages images and telemetry exactly as the CCSDS 133.0-B-2 standard specifies, including the CRC-16 checksum.
- A complete Medallion architecture: data flows through Raw → Bronze → Silver → Gold layers, each with a clear responsibility. Nothing is validated twice, and no step is skipped.
- Automatic anomaly detection: the system checks every temperature, pressure, and wind reading and flags the ones outside range, without anyone having to scan a table by hand.
- Everything versioned as code: not just the pipeline. The monitoring dashboard and the cloud infrastructure also live in the repository, not clicked together by hand in a UI.
- Hybrid infrastructure: runs locally with Docker, and includes an AWS variant (Terraform) ready to deploy, sized by the real cost of each service.
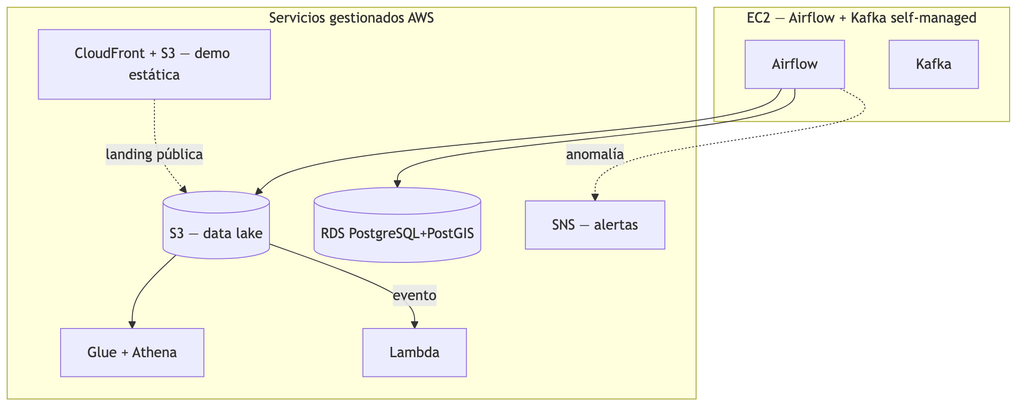
AWS – Architecture Diagram
The proof
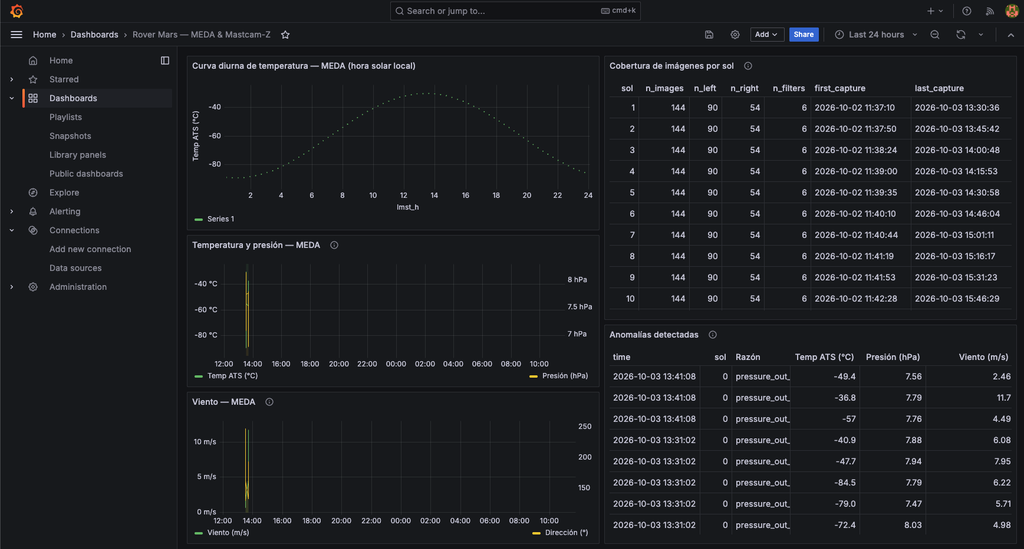
The dashboard doesn’t show sample data: the temperature curve reproduces the real shape of Mars’s physical model (minimum before dawn, maximum after Martian noon), generated by the simulator itself and processed by the full pipeline all the way to the screen.
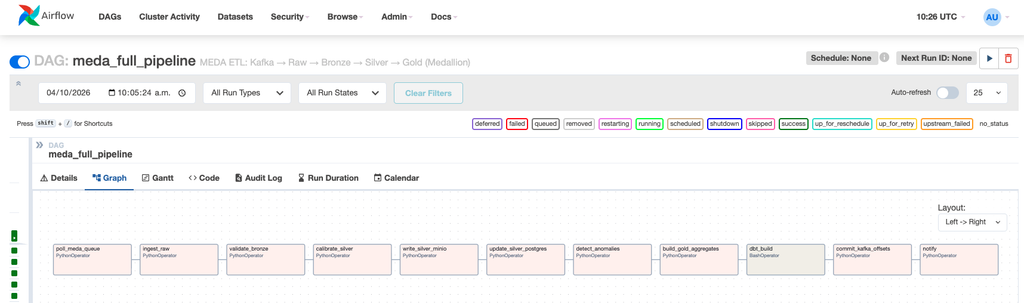
Orchestration with Airflow
A real story: how I almost lost the dashboard (and why it won’t happen again)
I built the monitoring dashboard directly in Grafana’s UI. It looked finished. The next day, the panels were gone: only the title remained. The root cause: none of the Grafana configuration was stored as code, so everything lived in an internal volume that any restart could wipe without warning. The fix wasn’t to rebuild the panels by hand a second time. I treated the dashboard like any other part of the system: I wrote it as versioned files (datasource.yml, the dashboard JSON) that rebuild automatically every time the service starts. Now a restart, a machine migration, or losing the disk no longer erases months of configuration work.
Methodology : Spec-Driven Development
The whole project was built under a specification-driven development methodology: every feature is specified, planned, and tested before it’s implemented, governed by a constitution of 8 non-negotiable principles (fidelity to the real domain, a Medallion architecture with no shortcuts, real verification through automated tests, no hardcoded secrets, among others). This is how I’m learning to work with AI agents on real projects: the agent speeds up writing code, but understanding, architecture decisions, and validation remain my responsibility.
Tech stack
Python · Apache Kafka · Apache Airflow · dbt · PostgreSQL/PostGIS · Docker · Terraform · AWS · Grafana · GitHub Actions